Digital twins can help us derive insights to control entities and processes in the digital world. Those insights can then be used to drive actions in the physical world. Simulation is one of the key enabling technologies that lie at the heart of digital twin development. This post uses the manufacturing process of a factory as an example. Then it discusses the role of simulation in the development of the factory digital twin.
What is a factory digital twin?
A factory digital twin consists of virtual representations of the physical manufacturing resources and processes that would exist in a factory. It can be developed for an existing factory and used for enhancing its resilience in the future.
Alternatively, it can be developed for a factory that has not been built yet but is under design. In this case, the factory digital twin is used for better management of the risk involved in making strategic investment decisions. The expected outcome is that the factory digital twin enables profit-optimal decisions despite the complexity of the manufacturing process flow and the high operational risk affecting cost and service.
At SAS, we understand that digital twins play a paramount role in our customers’ digital transformation efforts. We help our customers develop digital twin solutions to understand what did happen, predict what might happen, and stress test their business processes. We can also help identify the best courses of action to take when faced with disruptions.
Consider a factory where jobs arrive every 1.25 days on average. Jobs are processed one at a time on a first-come-first-served basis. The processing of any job lasts for an average of one day. A newly arrived job joins a queue if a job is already being processed. Figure 1 presents a high-level illustration of this factory flow. What is important to recognize is that both the interarrival times and processing times are highly variable. The expectation from a digital twin of this factory operating under a high level of uncertainty is threefold:
- Predict annual throughput
- Predict manufacturing lead time (for example, time a job spends in the factory)
- Control factory’s production rate to meet a target four-day manufacturing lead time

What is the role of simulation in the factory digital twin development?
Building digital twins requires a variety of analytics tools ranging from Internet of Things (IoT), statistical modeling, and visual analytics to computer vision, AI/ML, and optimization. However, at the heart of a factory digital twin lies a manufacturing process simulation driven by domain expertise and data. This simulation mimics the operations of the factory through which thousands of jobs might flow. It also generates key performance indicators (KPI), namely, annual throughout and manufacturing lead time.
Thus, a key role of simulation in digital twin development is to serve as a KPI generation program. If the digital twin is developed to provide strategic decision support for a factory that does not exist yet, then the simulation chooses the initial state of the factory as idle. However, if the digital twin is built to enhance the resiliency of an existing factory in the future, then the simulation starts at a state captured through the collection of the IoT data from the factory sensors.
Additionally, a simulation captures the high variability in the system’s inputs (jobs’ interarrival and processing time) and quantifies the risk in the KPI predictions. Furthermore, the simulation manages this risk through the identification of the best course of action to take - the control of the production rate and optimization of throughput and lead time under uncertainty.
Figure 2 illustrates the primary roles of simulation in factory digital twin development. They are grouped into the following three categories:
- KPI generation
- Risk calculation
- Risk management

Predicting annual throughput and manufacturing lead time, as well as characterizing their risk profiles, fall under the generation of KPIs and calculation of risks. Identifying the optimal production rate is the risk management component. There are two key simulation capabilities that allow such a role-play:
- Uncertainty modeling
- Explainable analytics
Uncertainty modeling and explainability are also why simulations are very critical in digital twin development.
Uncertainty modeling
Complexity along with uncertainty often invalidates the use of deterministic techniques for developing decision support solutions. If there were no uncertainty in the interarrival and processing times of the jobs in the factory (Figure 1), then the annual throughput would be 292 jobs (365 days/1.25 jobs per day). And the manufacturing lead time would be equal to one day for every job departing from the factory. However, the factory is exposed to risk due to the high variability in its arrival and production processes.
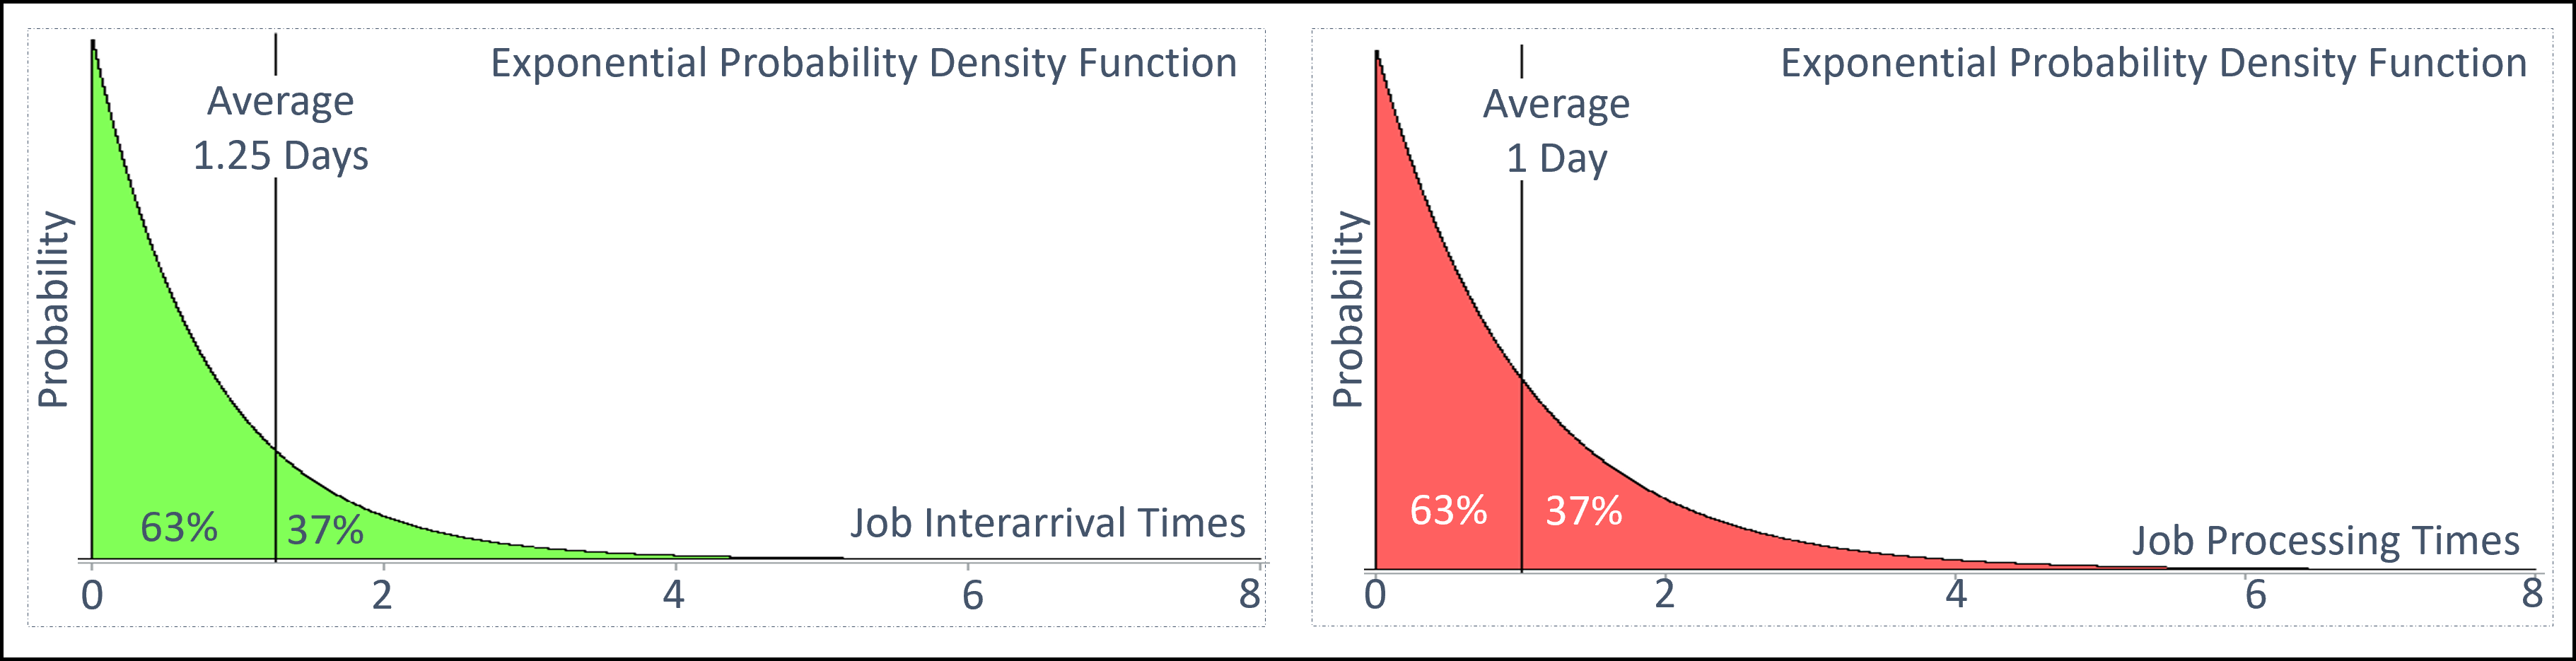
Input modeling is picking a probability distribution to represent randomness in a simulation. If a physical basis is known for distribution, then it can be matched to the situation. Because we only know the mean time between consecutive job arrivals (1.25 days) and the mean job service time (1 day), and each input process is highly variable, we choose an exponential probability density function for each input model. We do this because the density function of an exponentially distributed random variable is characterized by its mean value only and its coefficient of variation equals one, indicating high variability.
Figure 3 illustrates these input models for job interarrival time on the left-hand side. The right-hand side illustrates the job service time. In each case, there is a 37% chance for an input realization to exceed the mean value of its probability distribution.
The factory simulation predicts the mean annual throughout as 289 jobs with a standard deviation of 17 jobs. See Figure 4. Furthermore, the simulation predicts the mean annual throughput to fall between 286 jobs and 293 jobs. Thus, there is a 57% chance that annual throughput falls below 292 jobs, corresponding to what the factory manager would expect in the case of ignoring the input variability and selecting a deterministic technique over stochastic simulation for KPI prediction.
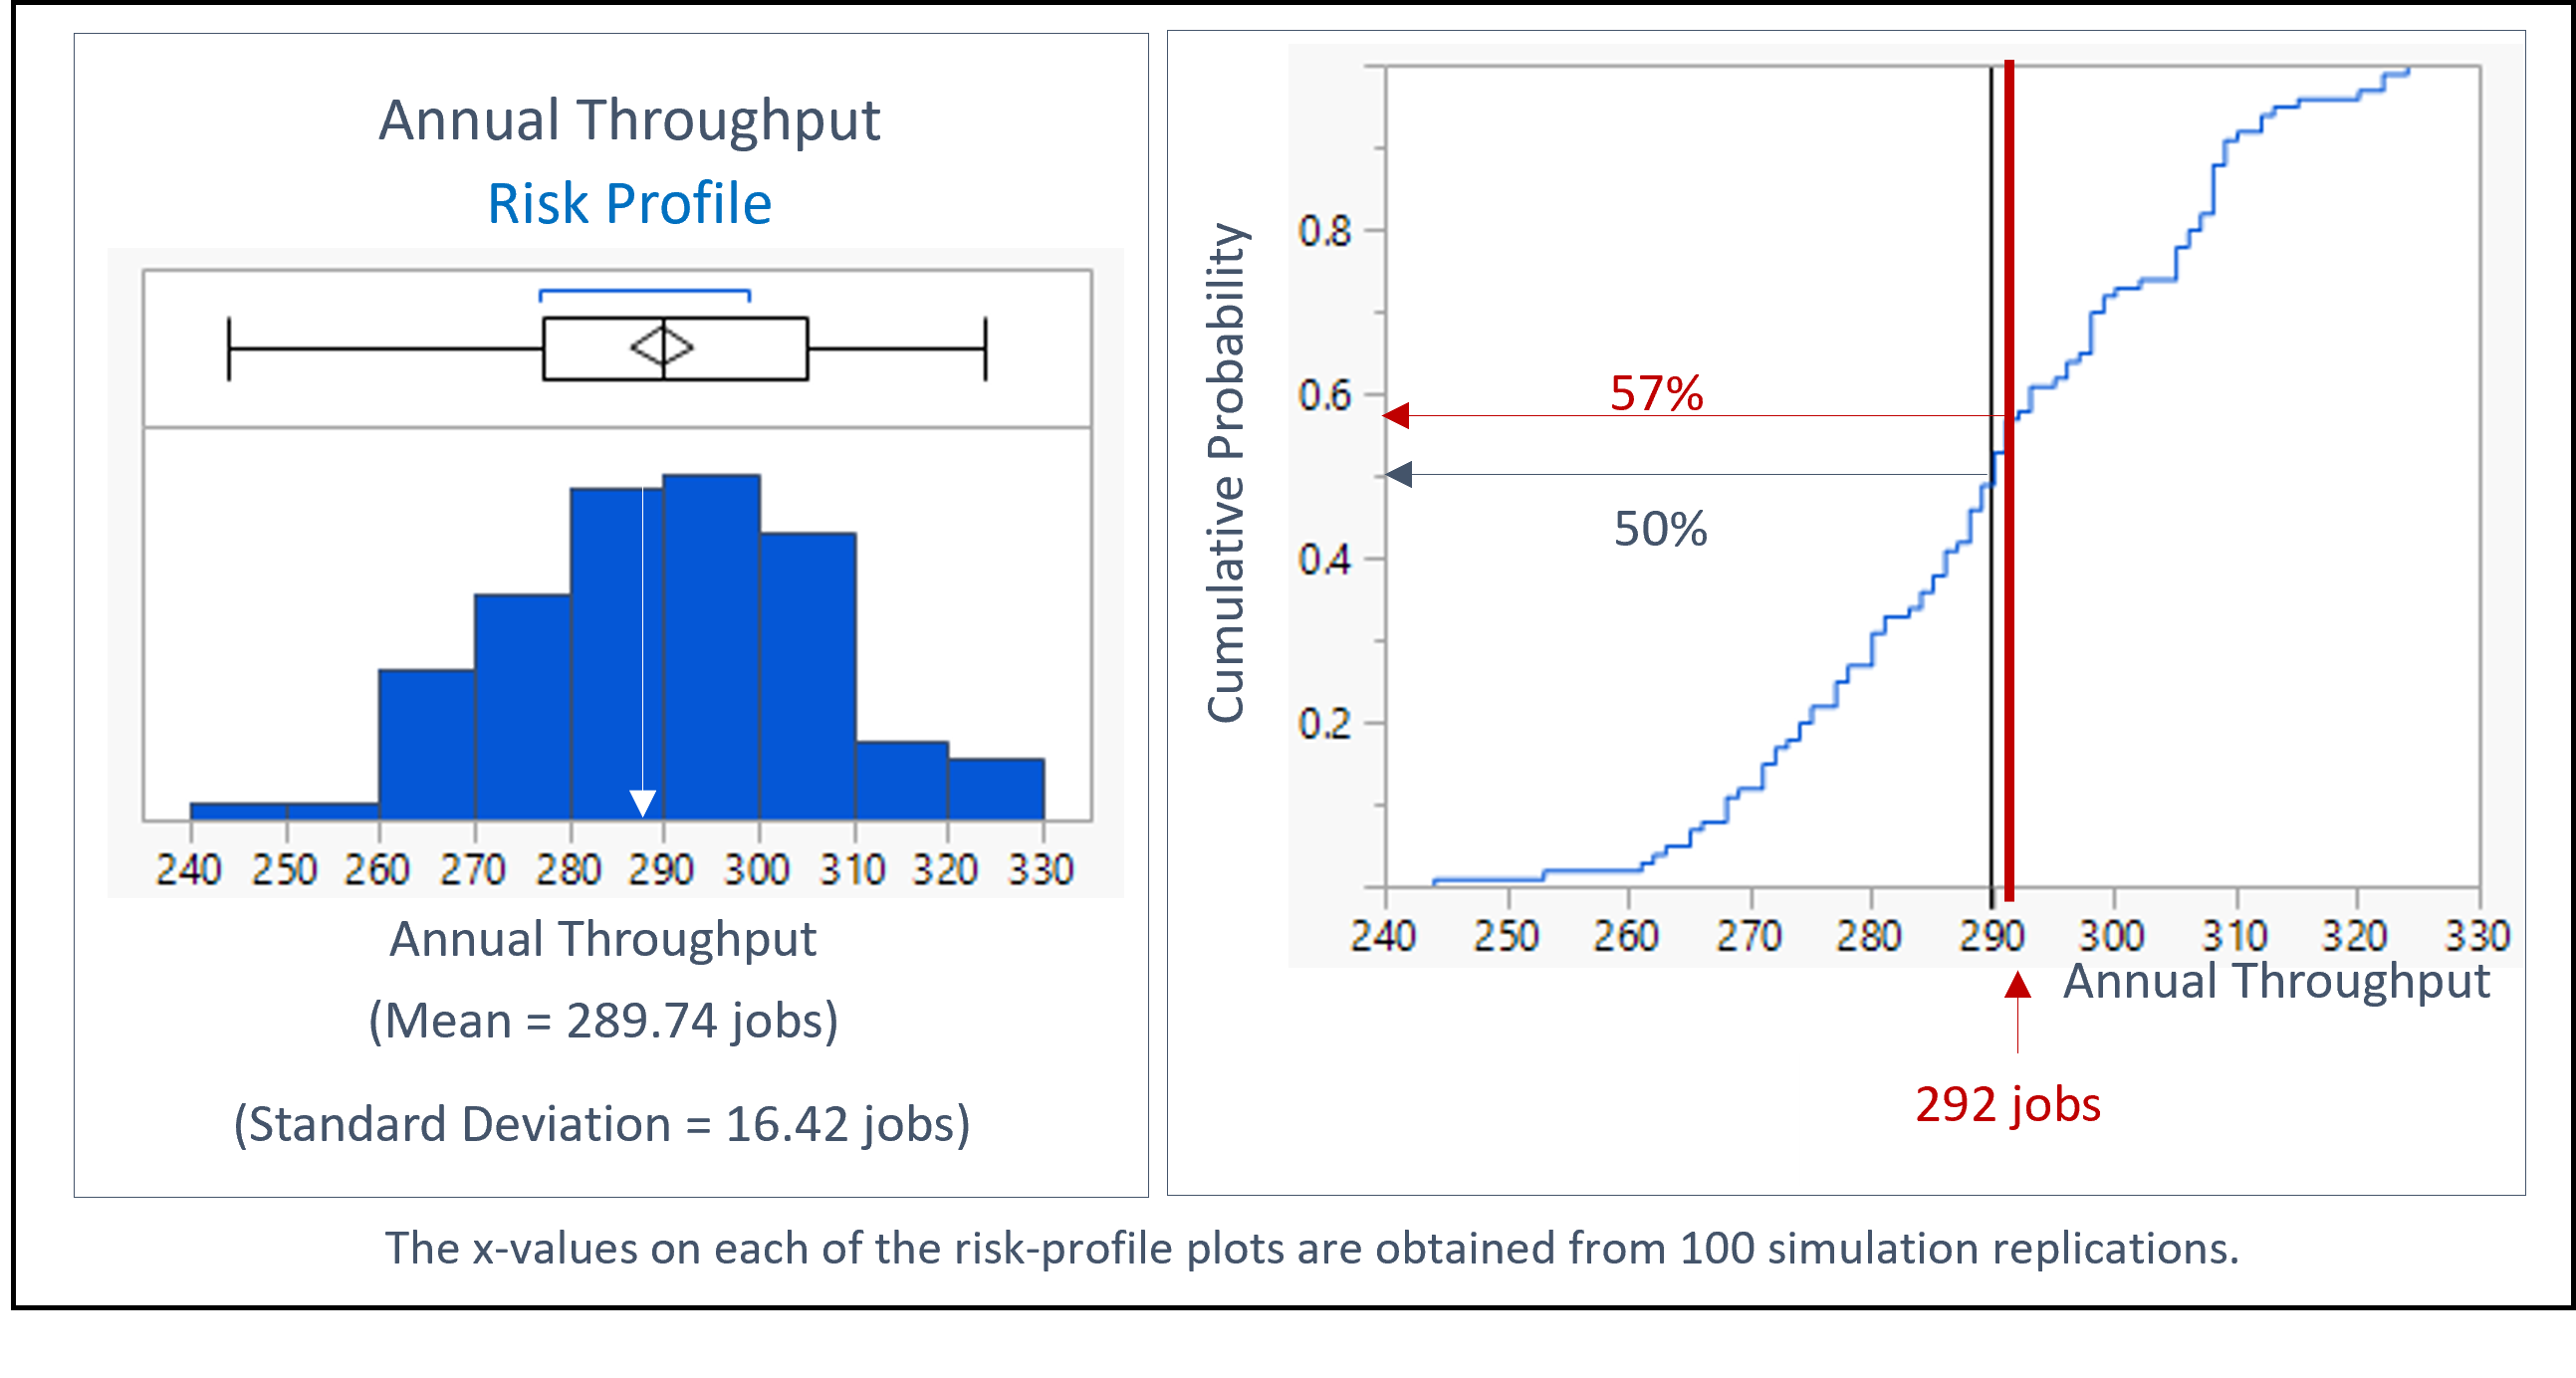
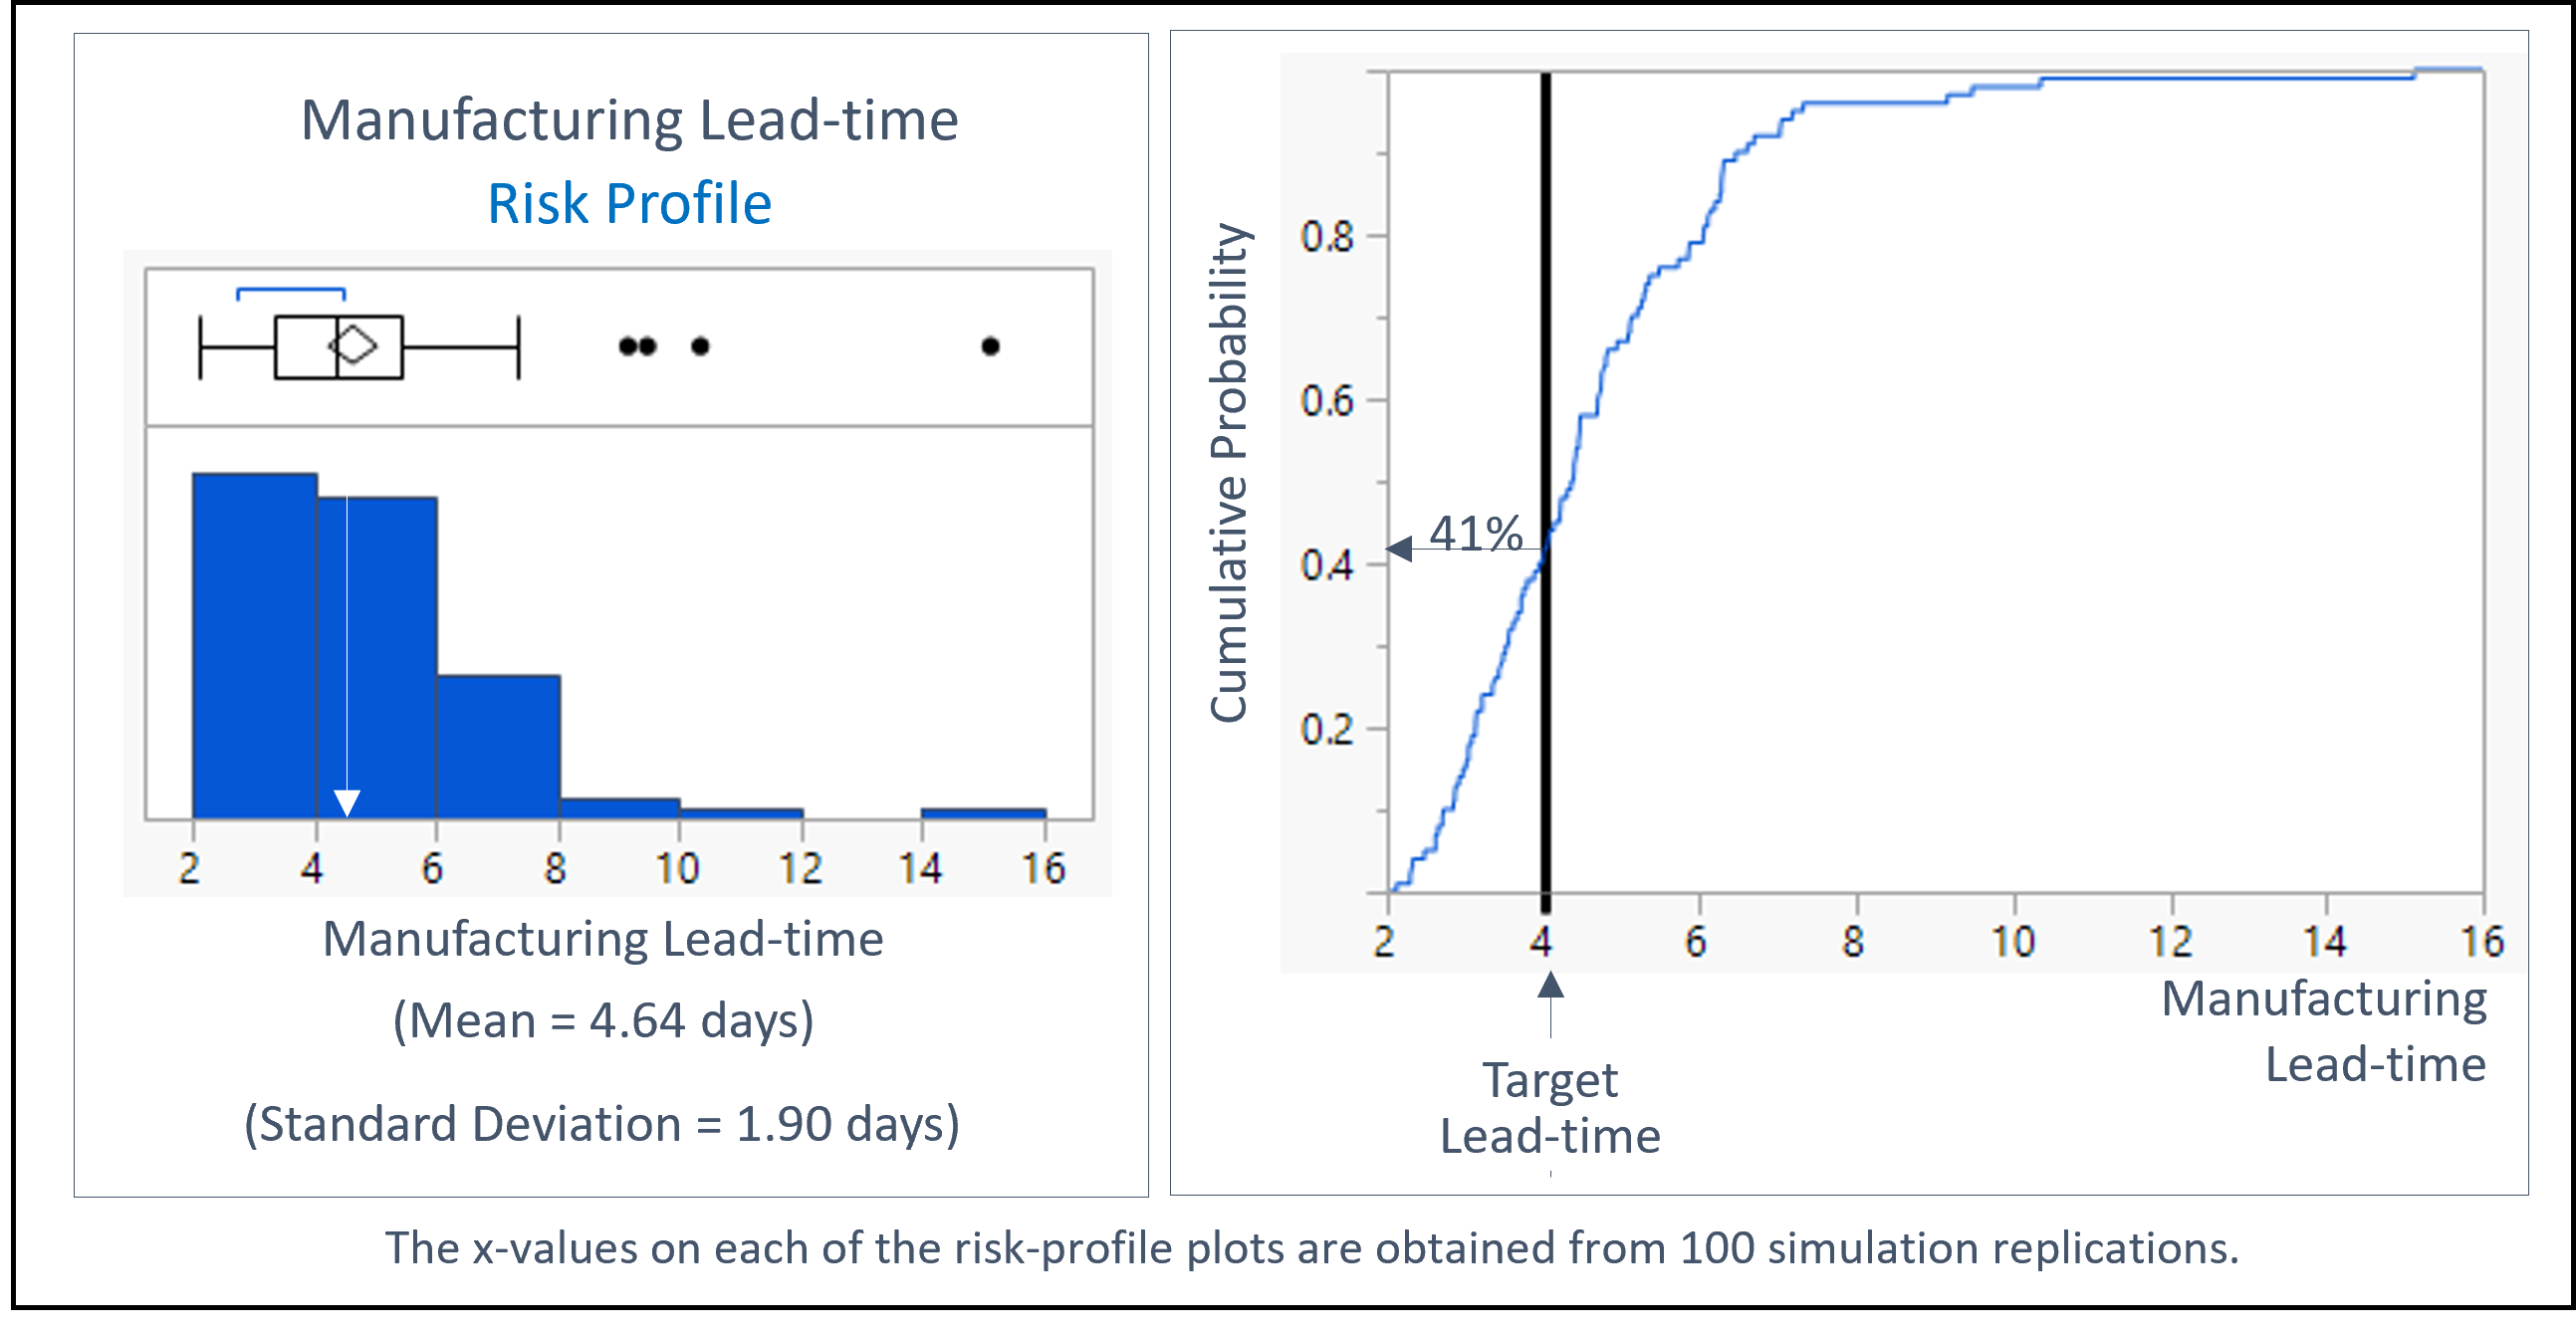
Figure 5 illustrates that the mean manufacturing lead time falls between 4.26 days and 5.02 days with 95% confidence. There is only a 41% chance that manufacturing lead time falls below the target lead time of four days. In other words, there is still a 59% chance that manufacturing lead time exceeds the target lead time. However, the integrated use of simulation, machine learning, and optimization for risk management identifies a minimum of 15% increase in product rate to ensure a lead time of four days with at least 95% probability. Thus, simulation is the only practical technology to model, understand, and optimize complex systems under uncertainty. Simulation is the pivotal component of digital twins.
Explainable analytics
Explainability is the key feature that enables simulation to complement composite AI. We illustrate this aspect of the simulation by considering a four-stage paint manufacturing facility with mixing machines, thinning and storage tanks, and packaging lines. The number of packaging lines in this facility is six. Captured by Scenario 1 in Figure 6 is the current facility design.
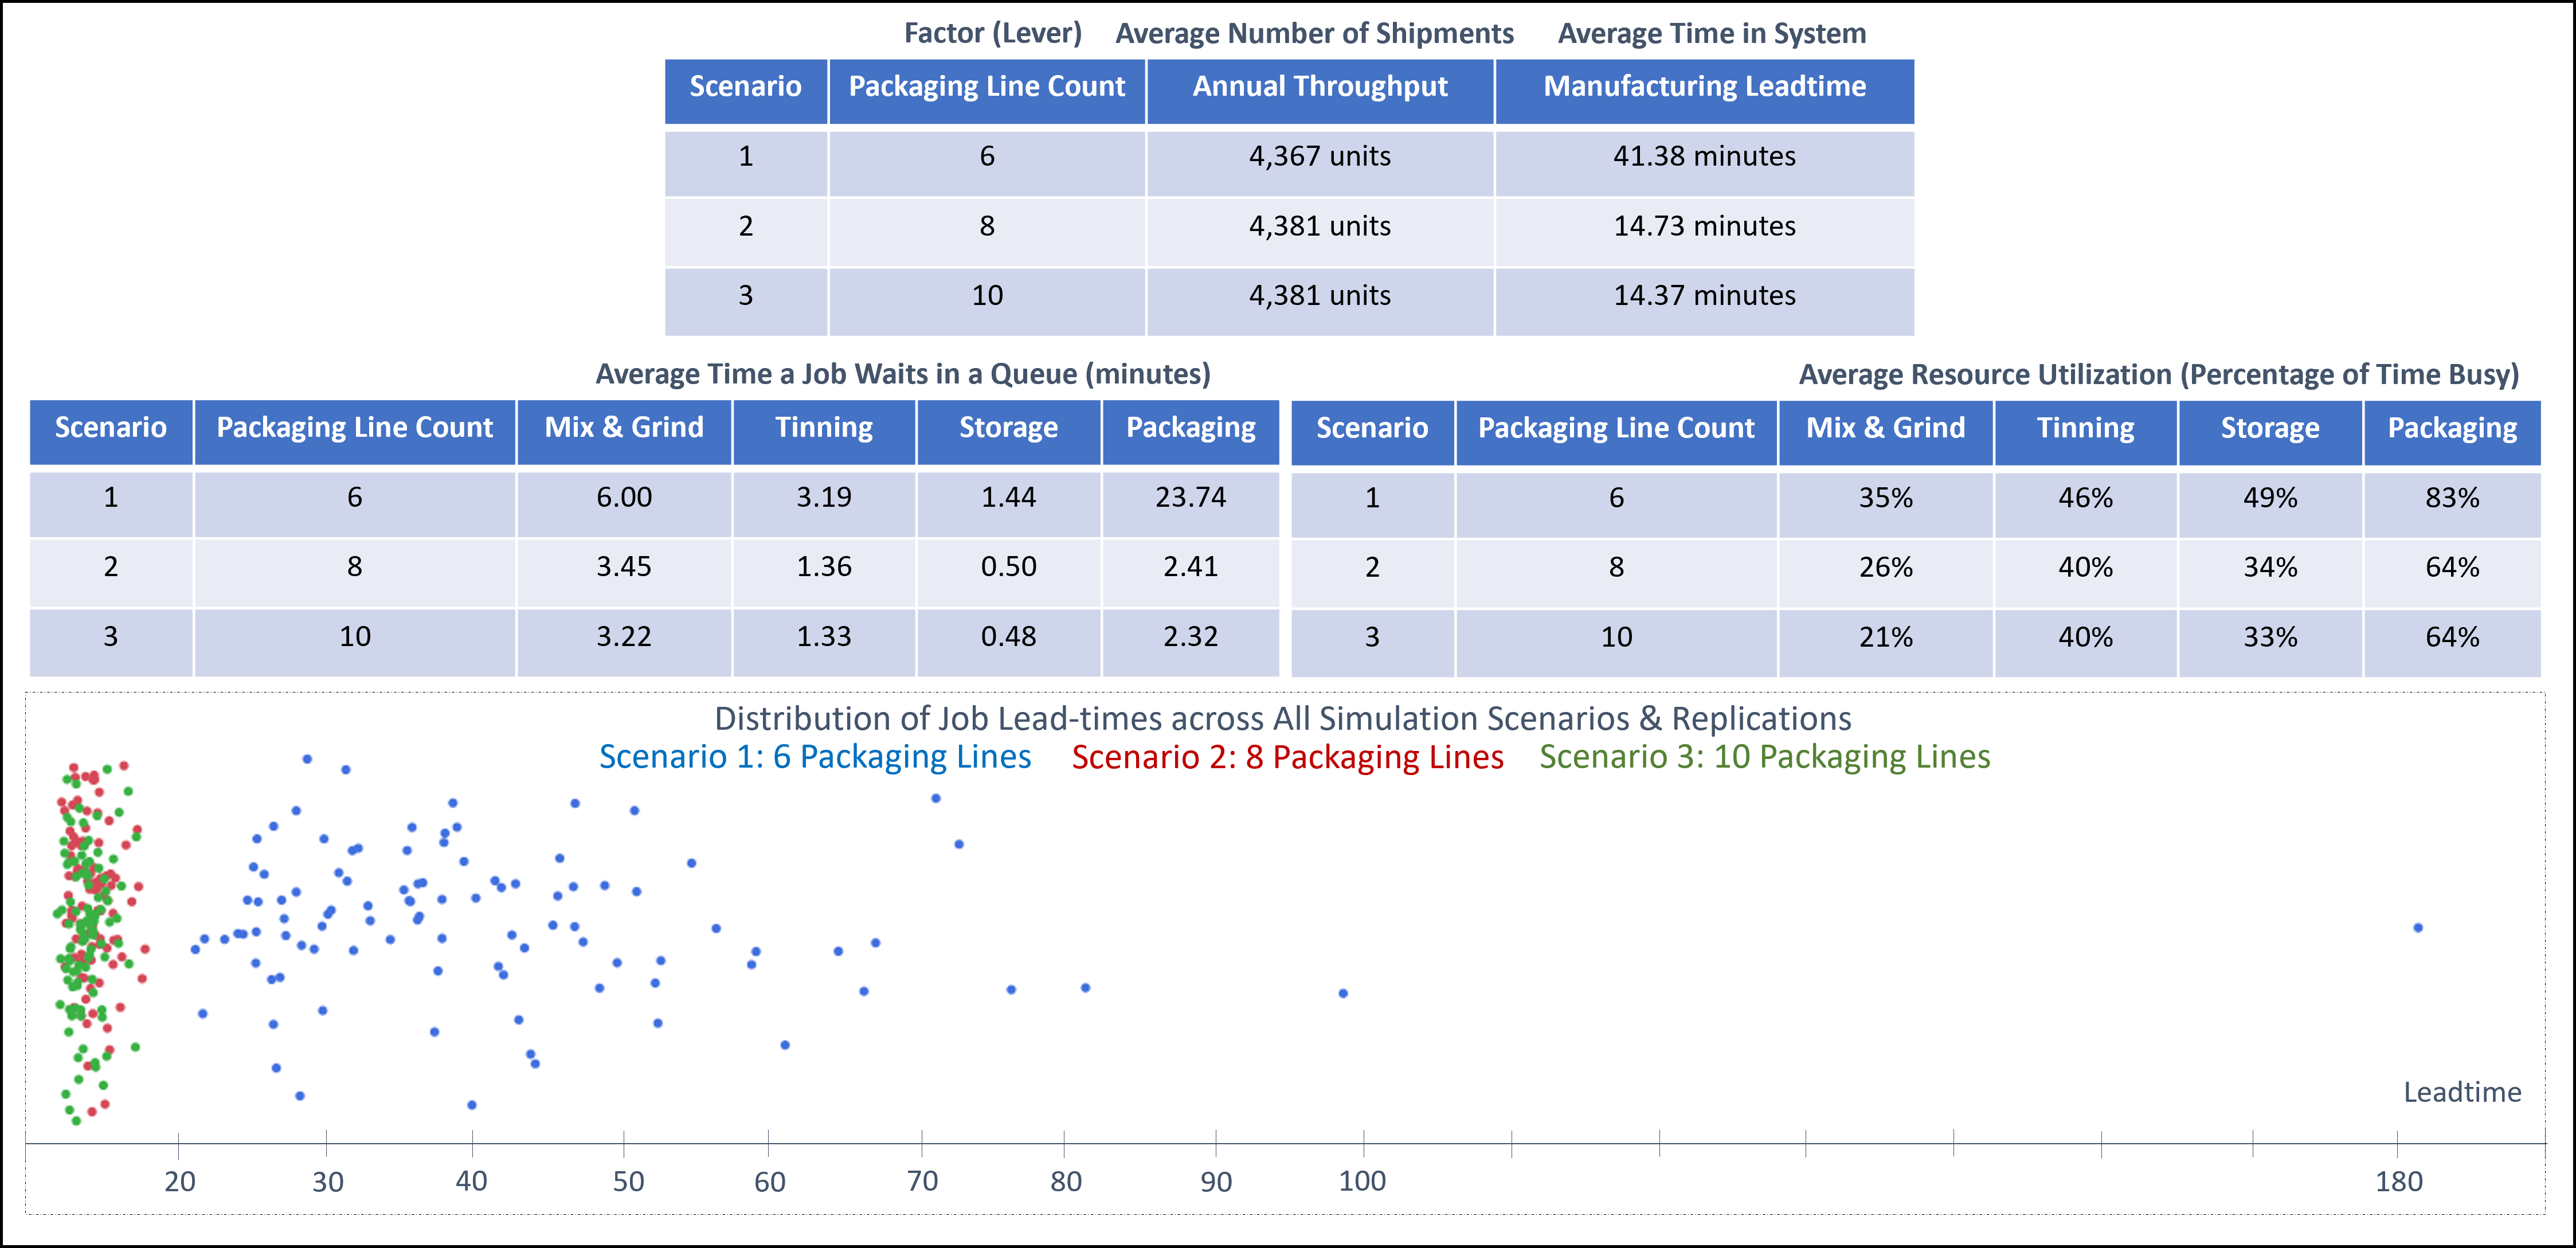
The process simulation predicts an annual throughput of 4,367 units and a manufacturing lead time of 41.38 minutes. Unlike any other prediction tool, the simulation can explain the reason behind good and bad performance with the help of bottleneck analysis.
Figure 6 tabulates the average time a job spends waiting in front of each machine group along with the utilization of the machine group. It identifies a 23.74-minute average wait time in front of the six packaging lines and average utilization of 83% for each of these lines. Thus, the simulation detects packaging as the factory bottleneck.
It further enables a scenario analysis that asks questions. What if two additional packaging lines are added to the current facility? And what if four additional packaging lines are added? Figure 6 provides the answer to the first question under Scenario 2. It also answers the second question under Scenario 3.
Notice that Scenario 2 presents numerical support to increase the packaging capacity from six lines to eight lines for the maximum favorable impact on annual throughput and factory lead time. It also supports the reduction in the average wait time experienced in the front of each machine group, and the decrease in variability in the distribution of job lead times displayed in the plot in Figure 6.
Scenario 3, on the other hand, shows no benefit in increasing the packaging line capacity from eight lines to ten lines. This is how simulation recommends increasing the current packaging capacity by two lines and explains this recommendation. This benefit of explainable analytics separates simulation from other prediction tools and turns it into a critical component of digital twin development.
Supporting the simulation development
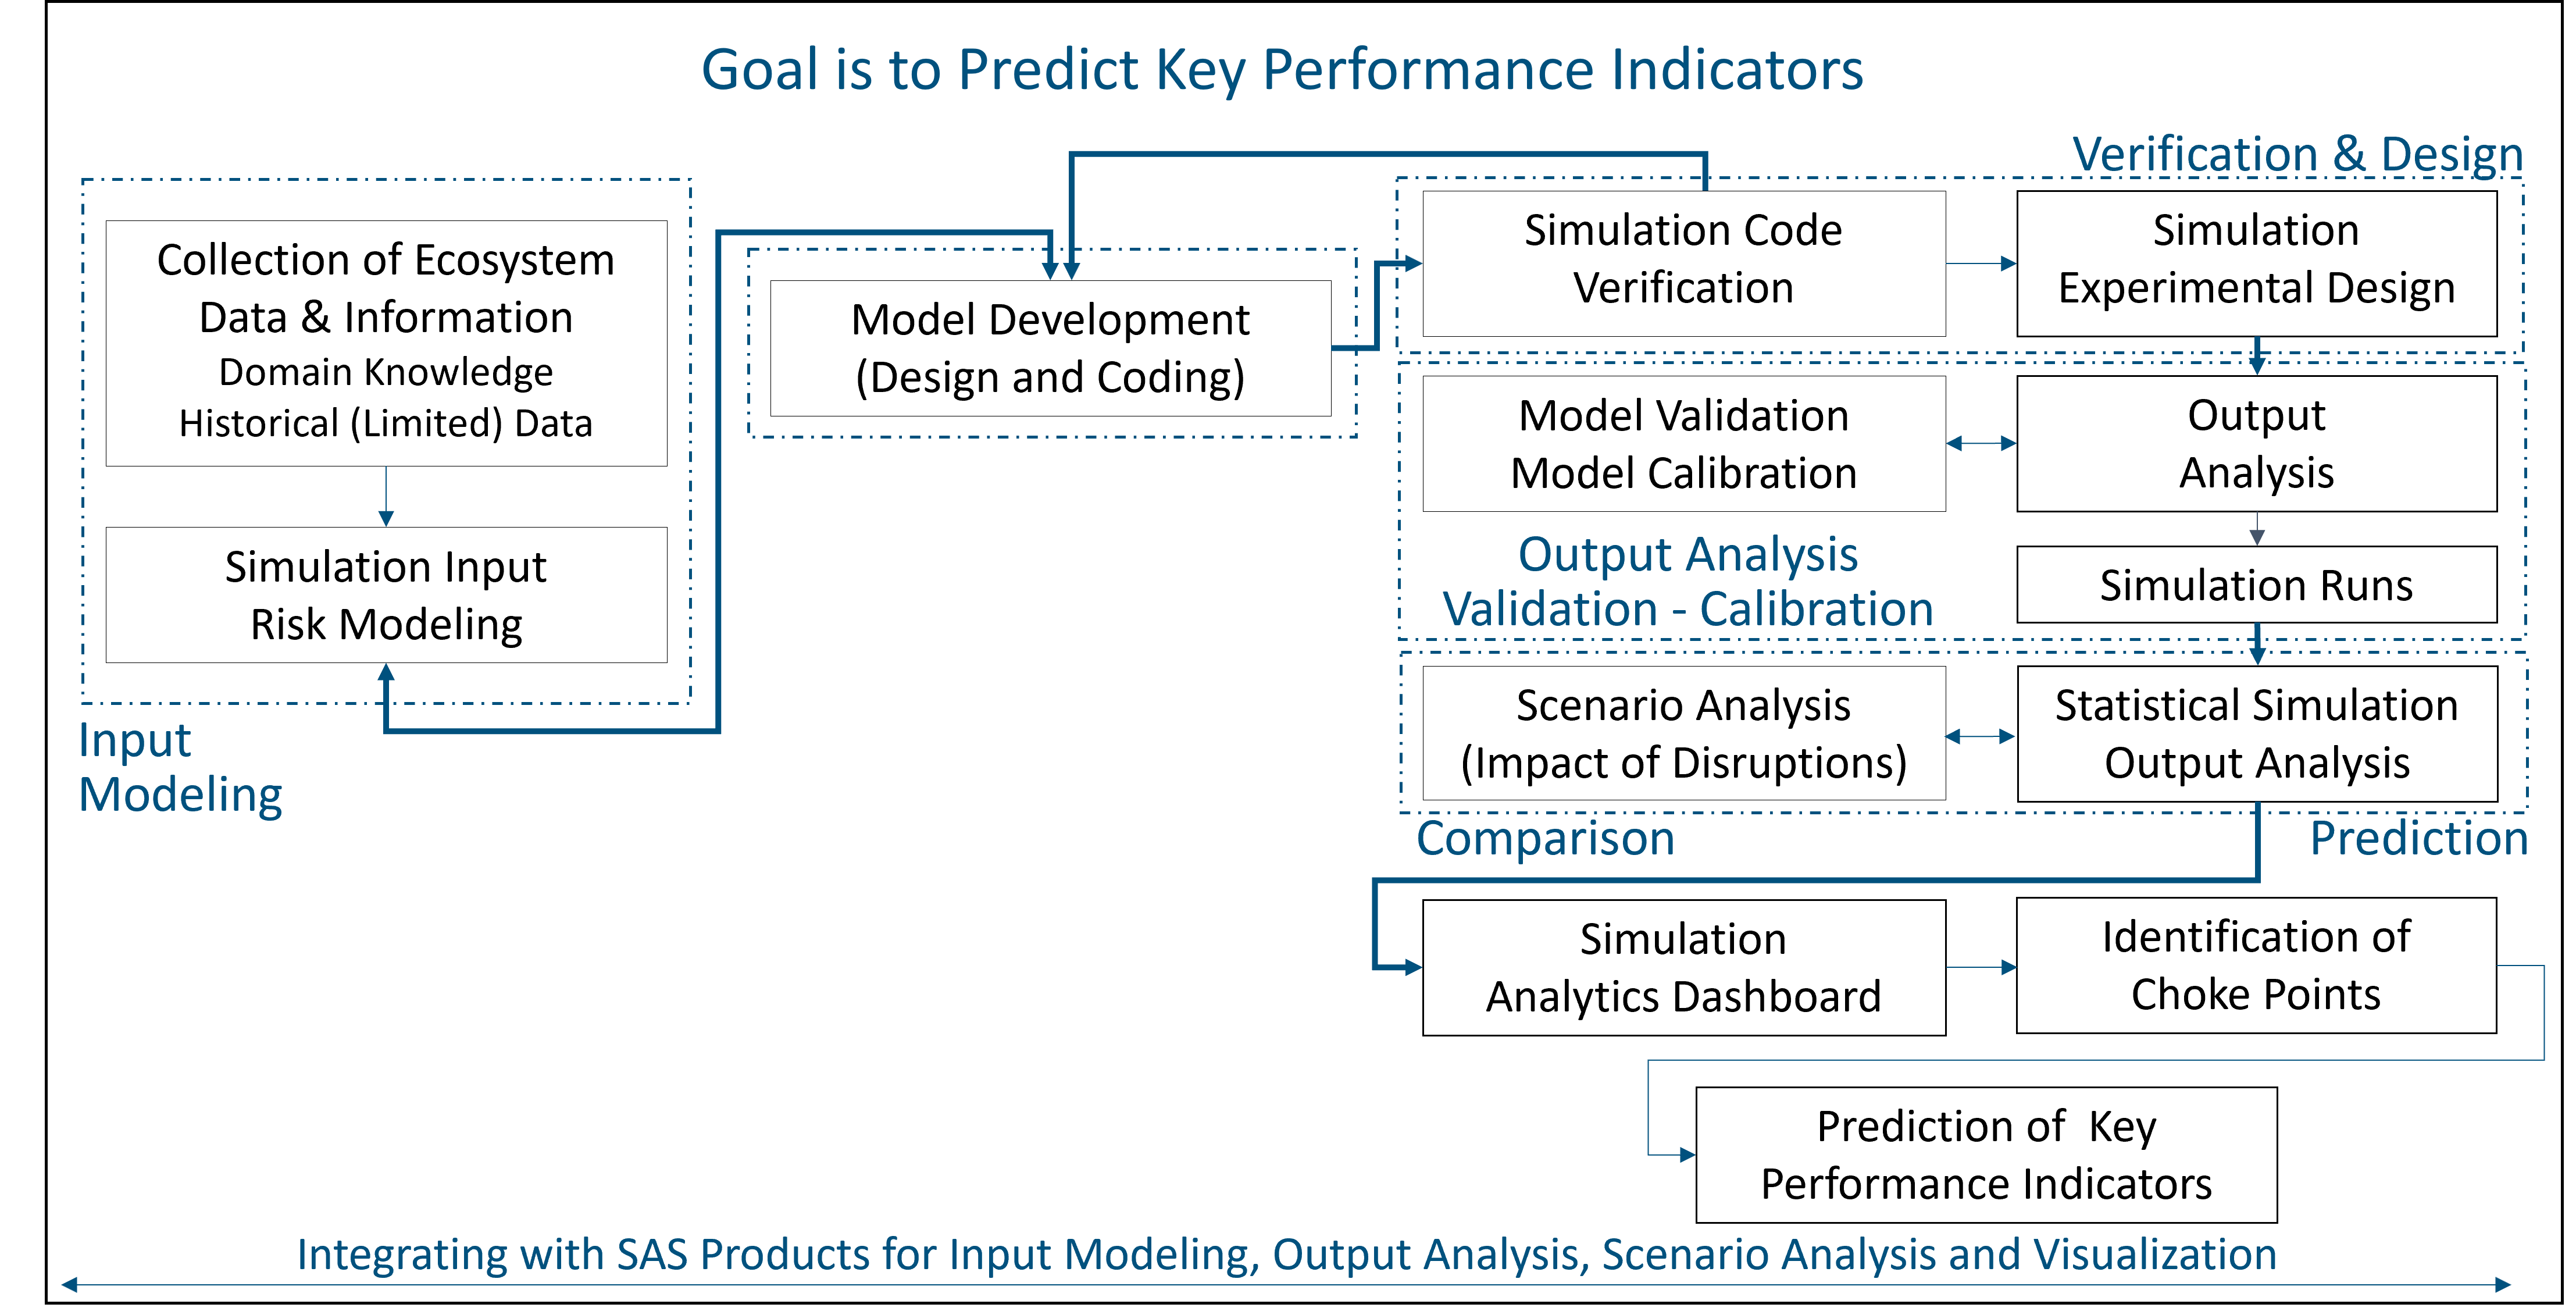
To build simulations as a component of digital twins, there are several modular steps that need to be completed:
- Input modeling
- Output analysis
- Verification, validation, and calibration
- Prediction, comparison, and visualization
Figure 7 illustrates how these modular tasks come together for the delivery of end-to-end business system KPI prediction. Notice that each step requires extensive use of some combination of statistics, stochastic process modeling, machine learning, and optimization. At SAS, we support our customers with the analytics products SAS Visual Analytics, SAS Visual Statistics, SAS Visual Data Mining and Machine Learning, and SAS Optimization to integrate with their simulation. This equips them with the power to develop integrated solutions for their complex problems. Here is a high-level description of such an effort for building a supply chain digital twin with SAS to predict intervals of product shortages, understand what might cause these shortages, and identify the best courses of action to take to optimize cost and service uncertainty. More recently, SAS has partnered with Cosmo Tech to build supply chain digital twin solutions.
Summary
This post discusses the critical role of simulation in digital twin development. A factory digital twin can be used to explain why simulations are critical. They enable KPI generation, risk quantification, and risk management —via uncertainty modeling and explainable analytics— for business systems with complex process flows and exposure to high levels of input risk. Empowered by simulations, digital twins are expected to remain integral to the digital transformation of customers in the years to come. We at SAS are committed to equipping our customers with the analytics power to help them succeed on this journey.